Babyplots is an easy to use library for creating interactive 3d graphs for exploring and presenting data.
The Node Plot Creator (or short NPC) allows you to interactively build babyplots visualizations, without writing a single line of code. You can download the plots that you create here as a .json file, to display them e.g. in the PowerPoint add-in, or you can publish them to your babyplots account, to easily share them with others.
All data processing in the NPC happens locally on your machine, no data is transferred to our servers, until you
specifically click on the publish button as a logged-in user, in the final visualization.
It is entirely possible to use the NPC without an account. You can just download the visualization that you have
created as a .json file.
The NPC is still in early and active development (hence the alpha tag in the tab). While a lot of functionality is already there, not everything that is possible using the babyplots library through the other implementations can be achieved with the NPC. Also, there are most certainly bugs. If you encounter any, or if you have questions about the NPC or this documentation, please let us know on our Discord server!
You can find the Node Plot Creator (hereinafter NPC) by clicking on the Creatoralpha tab in the top navigation bar of this website or by following this link.
The NPC works by adding and connecting so called nodes. Different nodes have different functions: There are e.g. input nodes that allow you to load in data, plot nodes that generate the visualizations, and much more. You can read about the different types of nodes in the Node types section. The goal is to create a network of nodes, starting e.g. at a node that loads a text file from your computer, doing some data processing through other nodes and ending in a plot node that creates the visualization.
These networks of nodes respond in real time to changes and create and update interactive previews of the visualizations (see Figure 7).
When first opening the NPC page, you will see a large empty gray area with an orange add-nodes button ("+") and a white info button ("i").
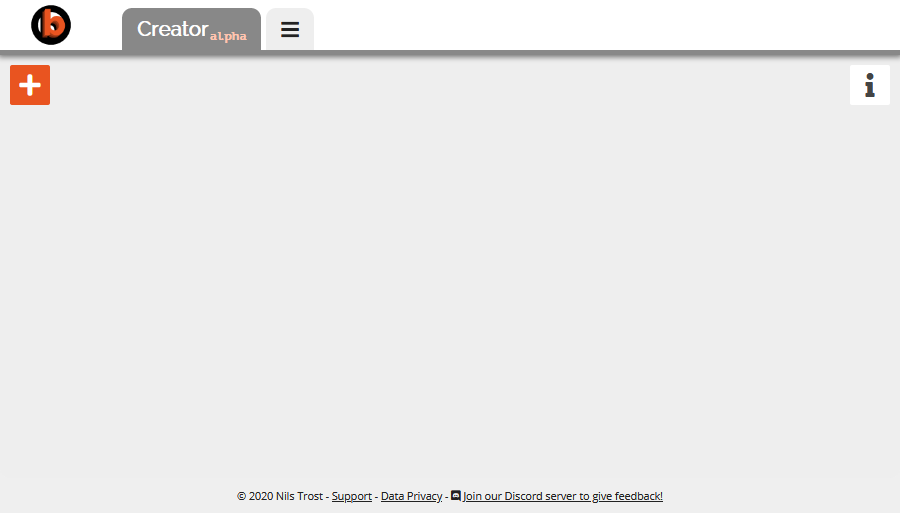 Fig. 1: The empty NPC area with the add-nodes and info buttons.
Clicking on the info button ("i"), brings up a window with a short overview of the NPC's functionality. Useful if you need a quick reminder. A button with an "x" in the top right of the info window will close it.
Clicking on the add-nodes button ("+"), brings up the node list. As the name suggests, all currently available node types are listed here, together with a short description on what the nodes do. A button with an "x" in the top left of the node list will close it.
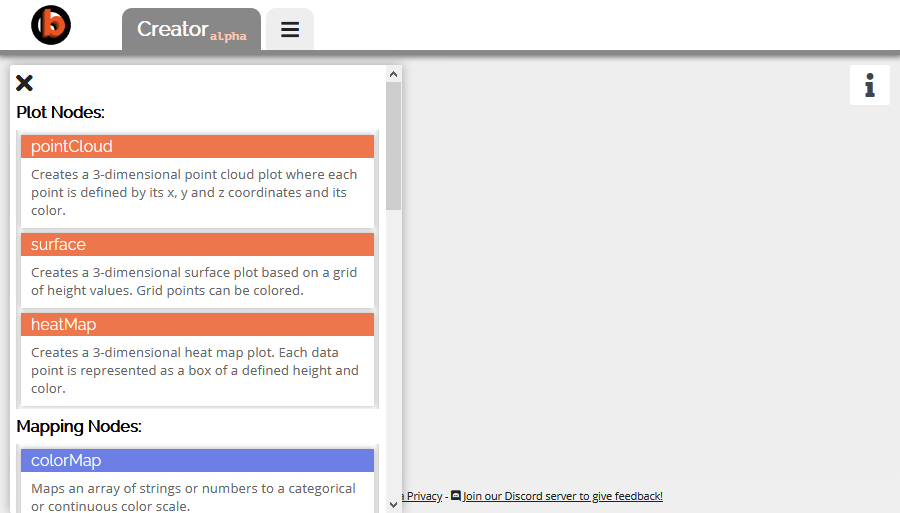 Fig. 2: The opened node list.
To add a node, simply click and hold your left mouse button over one of the nodes in the node list, drag the mouse into an empty spot in the gray NPC area and let go. This will create a new instance of that node type in your NPC area.
 Fig. 3: Adding a node to the NPC area.
After you have created your node, you can move it around by dragging it by its colored header. If you don't need a node anymore, you can dispose of it by dragging it to the top center of the NPC area, where a red button with a trash bin will appear, and letting go of the mouse button.
 Fig. 4: Moving and deleting a node in the NPC area.
Let's look at a node in detail (Figure 5). We can see that it has a colored header (1) that shows its name. Under the header is the nodes body. There we first find the options (2), these allow us to change properties of the node and how it processes data. Lastly, we see some labeled colored circles on the left and right borders of the node (3 and 4), these are connectors, which used to connect nodes to each other. Connectors on the left side of a node are inputs, connectors on the right side are outputs.
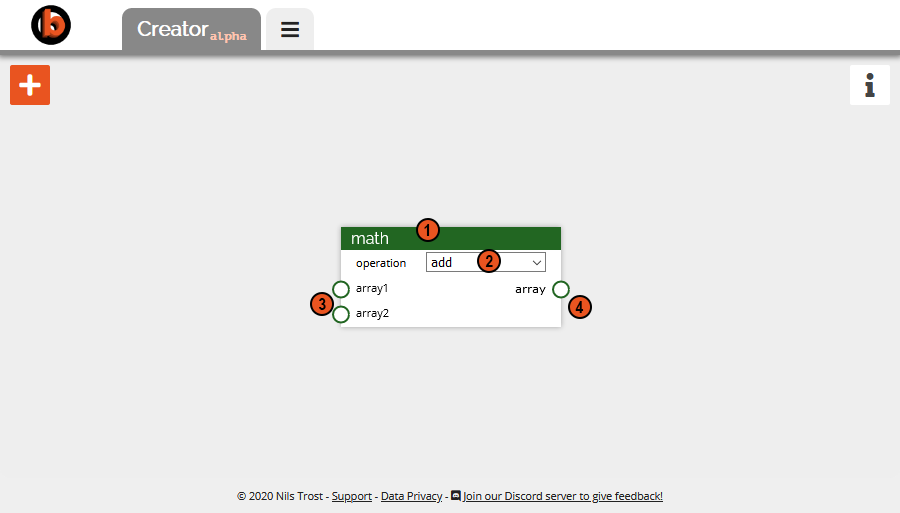 Fig. 5: A node in detail, showing (1) the header, (2) the options, (3) the inputs and
(4) the outputs.
Fig. 5: A node in detail, showing (1) the header, (2) the options, (3) the inputs and
(4) the outputs.
Clicking on an output connector while holding the control key on your keyboard shows a preview of what the node outputs at this connector.
To create visualizations using the NPC, you need to also connect the nodes that you have added. You can connect nodes only by connecting the output of one node to the input of another, or vice versa. Furthermore, you can only connect nodes using connectors that have the same color. The colors represent different data types that the outputs provide, and the inputs expect. More on this in the section on connector types.
To connect two nodes, start dragging from one connector and let go over a connector of another node that you want to connect. You will see, they are now connected with a colored line. When connecting two nodes, it does not matter from which node you start. You can disconnect the nodes by dragging from the input connector of a connected node and letting go over a free spot in the NPC area. Deleting a node also removes all connections to that node.
 Fig. 6: Connecting and disconnecting nodes.
Many input connector types also allow you to directly drag a connection starting from them into an empty spot of the NPC area. This will create the standard node type for this connector type, e.g. an array node, when dragging from an array connector, or a legendData node when dragging from a legendData connector, like in Figure 7.
 Fig. 7: Dragging from input nodes creates a node of the corresponding type.
When your node network becomes larger, it might be helpful to hide some less important information to save space. To do that, you can minimize nodes by clicking on the header of a node while pressing the control key on your keyboard. This will hide all options of the node, only showing the header, previews and connectors. To restore nodes, simply control-click the header again.
 Fig. 8: Minimizing and restoring nodes by control-clicking on the header.
This covered the basics of how to use the NPC. The following sections go into detail about the connector types, node types and how to export and publish the visualizations that you create using the NPC.
It's time to create your own visualizations, there are a lot of possibilities in the combination of all node types. Let your creativity run free.
Connectors come in different types, as shown by their color, to make sure connections are made only when the data types of the inputs and outputs are the same. Nodes are also colored by the type of their primary output type. The following connector types are currently available:
Clicking on an output connector while holding the control key on your keyboard shows a preview of what the node outputs at this connector (if available).
A single string or number value. Dragging out from a value input creates a value node by default.
1-dimensional arrays filled with either numbers or strings. Dragging out from an array input creates an array node by default. Arrays can be converted into matrix2d types with the toMatrix node.
2-dimensional matrix with columns and rows. You can flatten a matrix2d into an array with the flatten node.
Valid html colors (e.g. "green", "#ff0000"). Arrays of valid color values can be converted to the color type using the toColor node.
Special data type that connects a legendData node with plot nodes. Dragging out from a legendData connector creates a legendData node.
Special data type that connects a axisData node with plot nodes. Dragging out from an axisData connector creates an axisData node.
Contains plot data of a plot created with one of the plot nodes. You can connect multiple plot nodes with a babyplots node to combine them into one visualization.
Sometimes, you need to convert between connector types. Consider the following node set up (Figure 9): You have a matrix2d node, where you load a matrix from a text file. The output of this node is a matrix2d. You can plug this directly into the surface plot node's height data input. However, if you also want to color the surface by the same data, you have to convert the matrix2d data into the array data that the color-variable input of the plot node expects. In this case, the node you would use is the flatten node, which takes a matrix2d and flattens it into a 1-dimensional array.
 Fig. 9: Converting between two connector types. In this case, from matrix2d to
array.
Fig. 9: Converting between two connector types. In this case, from matrix2d to
array.
The NPC has different nodes for different functions. They can be broadly categorized into plot nodes, mapping nodes, input nodes, and data manipulation nodes. Nodes are colored by the type of their primary output type. Some node options change which inputs, or other options are available in the node.
Plot nodes create babyplots visualizations from data inputs. Plot nodes contain an interactive live preview. They allow you to export and publish the visualizations. To adjust the legend and the axis display of the visualization, plot nodes contain input connectors for legendData and axisData nodes.
The babyplots node can combine multiple plots created with the other plot nodes into one visualization.
| Name | Displayed if | Description |
|---|---|---|
| xScale | always | Scales the x axis by a factor. |
| yScale | always | Scales the y axis by a factor. |
| zScale | always | Scales the z axis by a factor. |
| Name | Type | Displayed if | Description |
|---|---|---|---|
| plot 1 | plotData | always | First plot to be added to the visualization. |
| plot 2 | plotData | always | Second plot to be added to the visualization. |
More plot inputs are created every time no free inputs are left. You can combine a (virtually) unlimited number of plots.
Point clouds are 3-dimensional scatter plots, where three variables (x, y and z) define the position of points in the coordinate system. One additional variable can be visualized by the color of the points.
| Name | Displayed if | Description |
|---|---|---|
| xScale | always | Scales the x axis by a factor. |
| yScale | always | Scales the y axis by a factor. |
| zScale | always | Scales the z axis by a factor. |
| colorBy | always | Determines how to color the plot, using a color input ("direct"), using an array of discrete "categories", or an array of continuous "values". |
| colorScale | colorBy is "categories" or "values" | Sets the color scale to use for the mapping of categories or values to colors. |
| inverted | colorBy is "categories" or "values" | Inverts the color scale. |
| size | always | Sets the size of the points in the plot. |
| Name | Type | Displayed if | Description |
|---|---|---|---|
| color | color | colorBy is "direct" | Direct assignment of colors to the points. |
| colorVar | array | colorBy is "categories" or "values" | Array of categories or values that are mapped to colors using the specified scale. |
| legendData | legendData | always | Connects to a legendData node to control the display options for the legend. |
| axisData | axisData | always | Connects to an axisData node to control the display options for the plot axes. |
| x | array | always | X coordinates for the points. |
| y | array | always | Y coordinates for the grid points. |
| z | array | always | Z coordinates for the points. |
| Name | Type | Displayed if | Description |
|---|---|---|---|
| plotData | plotData | always | The data of the created plot. Can be used to combine plots using the babyplots node. |
The surface plot creates a 3-dimensional surface that is defined by a height variable for each point on a x-y plane given by the rows and columns of a matrix2d. An additional variable can be visualized by the color of the surface points. The color is interpolated between the defined points of the surface.
| Name | Displayed if | Description |
|---|---|---|
| xScale | always | Scales the x axis by a factor. |
| yScale | always | Scales the y axis by a factor. |
| zScale | always | Scales the z axis by a factor. |
| colorBy | always | Determines how to color the plot, using a color input ("direct"), using an array of discrete "categories", or an array of continuous "values". |
| colorScale | colorBy is "categories" or "values" | Sets the color scale to use for the mapping of categories or values to colors. |
| inverted | colorBy is "categories" or "values" | Inverts the color scale. |
| Name | Type | Displayed if | Description |
|---|---|---|---|
| color | color | colorBy is "direct" | Direct assignment of colors to the points. |
| colorVar | array | colorBy is "categories" or "values" | Array of categories or values that are mapped to colors using the specified scale. |
| legendData | legendData | always | Connects to a legendData node to control the display options for the legend. |
| axisData | axisData | always | Connects to an axisData node to control the display options for the plot axes. |
| height | matrix2d | always | Height values for the surface in a 2-dimensional matrix. |
| Name | Type | Displayed if | Description |
|---|---|---|---|
| plotData | plotData | always | The data of the created plot. Can be used to combine plots using the babyplots node. |
The heat map is a 3-dimensional bar chart defined similarly to the surface plot, where the height of each bar on a x-y plane is given by the value in a row-column pair of a matrix2d. An additional variable can be visualized by the color of the bar.
| Name | Displayed if | Description |
|---|---|---|
| xScale | always | Scales the x axis by a factor. |
| yScale | always | Scales the y axis by a factor. |
| zScale | always | Scales the z axis by a factor. |
| colorBy | always | Determines how to color the plot, using a color input ("direct"), using an array of discrete "categories", or an array of continuous "values". |
| colorScale | colorBy is "categories" or "values" | Sets the color scale to use for the mapping of categories or values to colors. |
| inverted | colorBy is "categories" or "values" | Inverts the color scale. |
| size | always | Sets the thickness of the pillars. |
| Name | Type | Displayed if | Description |
|---|---|---|---|
| color | color | colorBy is "direct" | Direct assignment of colors to the points. |
| colorVar | array | colorBy is "categories" or "values" | Array of categories or values that are mapped to colors using the specified scale. |
| legendData | legendData | always | Connects to a legendData node to control the display options for the legend. |
| axisData | axisData | always | Connects to an axisData node to control the display options for the plot axes. |
| height | matrix2d | always | Height values for the pillars in a 2-dimensional matrix. |
| colnames | array | always | Column names for the axis. |
| rownames | matrix2d | always | Row names for the axis. |
| Name | Type | Displayed if | Description |
|---|---|---|---|
| plotData | plotData | always | The data of the created plot. Can be used to combine plots using the babyplots node. |
These nodes map values from the input to the corresponding output based on the selected options.
The colorMap node maps number or string arrays to colors based on the selected color scale and mapping method.
| Name | Displayed if | Description |
|---|---|---|
| colorBy | always | Determines how to color the plot, using an array of discrete "categories", or an array of continuous "values". |
| colorScale | always | Sets the color scale to use for the mapping of categories or values to colors. |
| inverted | always | Inverts the color scale. |
| Name | Type | Displayed if | Description |
|---|---|---|---|
| colorVar | array | always | Array of discrete categories or continuous values that are mapped to colors using the specified scale. |
| Name | Type | Displayed if | Description |
|---|---|---|---|
| color | color | always | The colors corresponding to the values or categories of the input. Same length and order as the input. |
These nodes allow you to load data from files or to create data from functions.
The dataTable node provides a data upload that allows you to load in tabular data. For each column in your data the node creates an array output. If your data has a header with column names the outputs will be named by the column names. The uploaded data should be in a tab separated format, without row names, as in the example below:
Column1	Column2	Column3
1	Person	#e95420
2	Woman	#ff0000
3	Man	#00ff00
4	Camera	#0000ff
5	TV	#000000
For this example, three array connectors would be created:
[1, 2, 3, 4, 5][Person, Woman, Man, Camera, TV][#e95420, #ff0000, #00ff00, #0000ff, #000000]Please note that the dataTable node does not make assumptions about the data types of the columns: Although column 3 contains color values, the connector will be of array type. To use them as colors (e.g. for a plot node), you need to pass the array through a toColor node, which will test each item of the array if it is a valid color and then provide it as a color output.
All data processing in the NPC happens locally on your machine, no data is transferred to our servers, until you specifically click on the publish button in the final visualization.
| Name | Displayed if | Description |
|---|---|---|
| includes header | always | Check this box, if the first line in your file contains the names of the columns. If this option is checked, the entries in the first line are used as the labels for the output arrays. |
| upload data | always | Click this button to load a file from your system into the NPC. |
| Name | Type | Displayed if | Description |
|---|---|---|---|
| [column name] | array | data was uploaded | For each column in the file, the node creates an array output. |
The matrix2d node provides a data upload that allows you to load in numeric matrix data. One output of type matrix2d is generated that contains all values of the matrix. It is possible to include row and column names, if you do, an array connector for each is generated. The uploaded data should be in a tab separated format as in the examples below:
With column and row names:
Column1	Column2	Column3
 Row1	 1	 2	 3
 Row2	 4	 5	 6
 Row3	 7	 8	 9
 Row4	10	11	12
 Row5	13	14	15
Without column or row names:
0.0	0.0	0.0
0.0	0.5	0.0
0.5	1.0	0.5
0.0	0.5	0.0
0.0	0.0	0.0
All data processing in the NPC happens locally on your machine, no data is transferred to our servers, until you specifically click on the publish button in the final visualization.
| Name | Displayed if | Description |
|---|---|---|
| includes column names | always | Check this box, if the first line in your file contains the names of the columns. If checked, an array output with the column names is created. |
| includes row names | always | Check this box, if the first line in your file contains the names of the rows. If checked, an array output with the row names is created. |
| upload data | always | Click this button to load a file from your system into the NPC. |
| Name | Type | Displayed if | Description |
|---|---|---|---|
| matrix | matrix2d | data was uploaded | The matrix data from the uploaded file. |
| colnames | array | data was uploaded with column names | The column names. |
| rownames | array | data was uploaded with row names | The row names. |
This is a special node that you can use to customize the legend display of a visualization.
| Name | Displayed if | Description |
|---|---|---|
| show legend | always | Determines if a legend should be drawn. |
| position | always | Positions the legend to the left or to the right of the visualization. |
| font size | always | The font size of the legend text. |
| font color | always | The color of the legend text. |
| title | always | The title of the legend. |
| title font size | always | The font size of the legend title. |
| Name | Type | Displayed if | Description |
|---|---|---|---|
| legendData | legendData | always | The legend data to be connected to a plot node. |
This is a special node that you can use to customize the axis display of a visualization.
| Name | Displayed if | Description |
|---|---|---|
| show x axis, show y axis, show z axis |
always | Determines if the given axis should be drawn. |
| x axis label, y axis label, z axis label |
always | The text of the labels that are shown next to the given axis. |
| x axis color, y axis color, z axis color |
always | The color of the given axis. |
| x tick breaks, y tick breaks, z tick breaks |
always | The interval between the ticks on the given axis. |
| show xy tick lines, show xz tick lines, show yx tick lines, show yz tick lines, show zx tick lines, show zy tick lines |
always | Determines if lines spanning the plane between two axes should be drawn. |
| xy tick line color, xz tick line color, yx tick line color, yz tick line color, zx tick line color, zy tick line color |
always | The color of the tick lines spanning the plane between two axes. |
| Name | Type | Displayed if | Description |
|---|---|---|---|
| axisData | axisData | always | The axis data to be connected to a plot node. |
This node creates a single color. If connected to the color input of a plot node, all data points of the plot are assigned this color.
| Name | Displayed if | Description |
|---|---|---|
| color | always | A valid html color (e.g. red, or #ff0000). |
| Name | Type | Displayed if | Description |
|---|---|---|---|
| color | color | always | The chosen color. |
This node creates an array of a given length and fills it either with a single value (repeated along the length of the array), a sequence of values (given by a start value and a step), or a range of values (given by a start and an end value). The length of the array can be defined either manually or copied from the length of an input array.
| Name | Displayed if | Description |
|---|---|---|
| choose length from | always | Determines, if the length is determined manually with a length option or copied from an input array. |
| fill with | always | Determines, if the array should be filled with a single repeated value, a sequence, or a range of values. |
| value | fill with is "value" | The value to fill the array with. |
| start | fill with is "sequence" or "range" | The starting value of the sequence or range to fill the array with. |
| step | fill with is "sequence" | The step to increment the value of the array for each item. |
| end | fill with is "range" | |
| length | choose length from is "option" | Determines the length of the array. |
| Name | Type | Displayed if | Description |
|---|---|---|---|
| length | array | choose length from is "length" | The created array will have the same length as the array connected to this input. |
| Name | Type | Displayed if | Description |
|---|---|---|---|
| array | array | always | The created array. |
This node creates a single string or number value.
| Name | Displayed if | Description |
|---|---|---|
| value | always | The value to output. |
| Name | Type | Displayed if | Description |
|---|---|---|---|
| value | value | always | The created value. |
These nodes allow you to manipulate data using functions and to convert between types.
The math node implements various mathematical operations to perform elementwise on one or two input arrays to create an output array.
The following operations are available (all operations are performed elementwise):
| Name | Description |
|---|---|
| add | \(array = array1 + array2\) |
| multiply | \(array = array1 \times array2\) |
| subtract | \(array = array1 - array2\) |
| divide | \(array = array \div array2\) |
| greater than | $$array = \begin{cases} 1, & \text{if } array1 > array2\\ 0, & \text{if } array1 \leq array2 \end{cases}$$ |
| greater or equal | $$array = \begin{cases} 1, & \text{if } array1 \geq array2\\ 0, & \text{if } array1 < array2 \end{cases}$$ |
| less than | $$array = \begin{cases} 1, & \text{if } array1 < array2\\ 0, & \text{if } array1 \geq array2 \end{cases}$$ |
| less or equal | $$array = \begin{cases} 1, & \text{if } array1 \leq array2\\ 0, & \text{if } array1 > array2 \end{cases}$$ |
| equal to | $$array = \begin{cases} 1, & \text{if } array1 = array2\\ 0, & \text{if } array1 \neq array2 \end{cases}$$ |
| not equal to | $$array = \begin{cases} 1, & \text{if } array1 \neq array2\\ 0, & \text{if } array1 = array2 \end{cases}$$ |
| absolute | \(array = \lvert array1 \rvert \) |
| power | \(array = array1^{array2}\) |
| logarithm | \(array = \ln array1\) |
| square root | \(array = \sqrt{array1}\) |
| exponential | \(array = e^{array1}\) |
| sine | \(array = \sin array1\) |
| cosine | \(array = \cos array1\) |
| tangent | \(array = \tan array1\) |
| arcsine | \(array = \arcsin array1\) |
| arccosine | \(array = \arccos array1\) |
| arctangent | \(array = \arctan array1\) |
| Name | Displayed if | Description |
|---|---|---|
| operation | always | The mathematical operation to perform on the input array(s). |
| Name | Type | Displayed if | Description |
|---|---|---|---|
| array1 | array | always | The (first) array to be used in the operation. |
| array2 | array | the chosen operation requires two values (see operations table) | The second array to be used in the operation. |
| Name | Type | Displayed if | Description |
|---|---|---|---|
| array | array | always | The resulting array. |
This node flattens a 2-dimensional matrix into a 1-dimensional array. The toMatrix node performs the reverse operation.
| Name | Type | Displayed if | Description |
|---|---|---|---|
| matrix2d | matrix2d | always | The input matrix. |
| Name | Type | Displayed if | Description |
|---|---|---|---|
| array | array | always | The flattened array. |
This node creates a 2-dimensional matrix from a 1-dimensional array. The number of columns and rows can be specified to control the shape of the resulting matrix. When you specify the number of rows the number of columns is calculated automatically (if possible) and vice versa. The flatten node performs the reverse operation.
| Name | Displayed if | Description |
|---|---|---|
| n rows | always | The number of rows for the resulting matrix. |
| n columns | always | The number of columns for the resulting matrix. |
| Name | Type | Displayed if | Description |
|---|---|---|---|
| array | array | always | The input array. |
| Name | Type | Displayed if | Description |
|---|---|---|---|
| matrix2d | matrix2d | always | The resulting matrix. The shape is defined by the n rows and n columns options. |
Concatenates two or more arrays into one array. New input connectors are created everytime all input connectors are connected. The "clear inputs" button allows you to remove unused input connectors.
| Name | Type | Displayed if | Description |
|---|---|---|---|
| array1 | array | always | The first input array. |
| array2 | array | always | The second input array. |
| Name | Type | Displayed if | Description |
|---|---|---|---|
| array | array | always | The concatenated array. |
Splits an array into two or more arrays, either once at n, or every n items.
| Name | Displayed if | Description |
|---|---|---|
| split | always | Split either once at n or every n items. |
| n | always | Where to split. |
| Name | Type | Displayed if | Description |
|---|---|---|---|
| array | array | always | The input array. |
| Name | Type | Displayed if | Description |
|---|---|---|---|
| [arrays 0:n, n:n] | array | when input array is split | The split arrays. |
This node ensures all items in an array are valid colors and outputs a color array. Note: This node performs no conversion! To map colors to items in an array, use the colorMap node.
This node is useful to tell the NPC that a column of a dataTable node contains colors and can be used as an input for the color connector of a plot node.
| Name | Type | Displayed if | Description |
|---|---|---|---|
| array | array | always | The input array with valid html colors (e.g. red, or #ff0000). |
| Name | Type | Displayed if | Description |
|---|---|---|---|
| color | color | always | The same as the input array, but with a color connector. |
After creating a visualization, you can export it to a .json file (e.g. to use it in the PowerPoint add-in), or you can publish it to your babyplots account, to easily share it with others. As soon as all of the required inputs of a plot node are connected, a plot is created, and the export/publish button will be available at the top of the node. Clicking this button brings up the following dialog:
 Fig. 10: Export or publish a visualization.
The publish button, the description text field and the options listed and private in the dialog are only available for logged-in users. The listed option determines, if the plot is shown in your public profile, if it is not listed, it can still be linked to with the exact URL. The private option determines, if the plot can be viewed by anybody that was not explicitly given access to. If it is private, it can be only accessed by you or another logged-in user with whom you have shared the plot.
Only if you choose to publish a plot, will data be uploaded to our servers. All other processing happens locally on your machine.