Babyplots is an easy to use library for creating interactive 3d graphs for exploring and presenting data.
The babyplots R package can be installed from its bitbucket page using devtools:
remotes::install_bitbucket("derpylz/babyplots.git")And loaded in your R session with:
library(babyplots)This will expose the plotting functions:
pointCloud()
shapeCloud()
heatMap()
surface()
linePlot()
imgStack()
meshObject()
as well as the Shiny bindings:
babyplotOutput()
renderBabyplot()
You can remind yourself of the arguments to the plotting functions at any time using the R manual:
?pointCloud
?shapeCloud
?heatMap
?surface
?linePlot
?imgStack
?meshObject
You can create a simple plot using any of the plotting functions, which directly prints the resulting visualization. Alternatively, you can assign the return value of the plotting functions to a variable. This allows you to later change some of the properties of the resulting babyplots object, as well as to add additional plots to the visualization.
# surface plot of height data
surf1 <- surface(coordMatrix, "values", as.vector(t(coordMatrix)),
                 backgroundColor = "#dfdfdf", showUI = TRUE,
                 xScale = 0.1, yScale = 0.01, zScale = 0.1)
# the same height data, but flipped
surf2 <- surface(-coordMatrix, "values", as.vector(t(coordMatrix)), showLegend = FALSE)

surf1 + surf2
The following sections explain the plotting functions and the babyplots object in more detail.
The following plot types are currently available in the babyplots package. Each plotting function returns a babyplots object, which when printed into the console shows the visualization.
Point clouds are 3 dimensional scatter plots, where three variables (x, y and z) define the position of points in the coordinate system. One additional variable can be visualized by the color of the points.
The pointCloud() plotting function takes the following arguments:
| Argument | Type | Default | Description |
|---|---|---|---|
| coords | matrix | required | 3 column matrix with x, y and z coordinates. |
| colorBy | character | required | Controls how the colorVar values are interpreted. Either "categories" for discrete values, "values" for continuous values, or "direct" when colorVar is a vector of colors in hex format (e.g. "#e95420"). |
| colorVar | character or numerical vector | required | Color variable for the data points, containing category names, numerical values, or hex color strings, depending on the colorBy parameter. |
| name | character | "point cloud" | Name of the plot for displaying it in a plot shape legend. |
| size | double | 1 | Point size |
| width | integer | NULL | Width of the widget, fits to the viewer pane when left empty. |
| height | integer | NULL | Height of the widget, fits to the viewer pane when left empty. |
| xScale | double | 1 | Scale x axis by a factor. |
| yScale | double | 1 | Scale y axis by a factor |
| zScale | double | 1 | Scale z axis by a factor |
| colorScale | character | NULL | Name of a colorbrewer scale (e.g. "OrRd"), "Viridis", or "custom". If set to "custom", the customColorScale parameter is also needed. |
| customColorScale | character vector | NULL | Character vector of at least 2 colors. Only needed if colorScale is set to "custom". |
| sortedCategories | character vector | NULL | Optional character vector with all category names if colorBy is "categories", to sort the categories in the legend and to the colorscale. |
| addClusterLabels | logical | FALSE | Add 3D labels at the centroids of the points belonging to the same category. |
| backgroundColor | character | "#ffffffff" | Color of background as hex color string. |
| showLegend | logical | TRUE | Display legend for categories of values. |
| showShape | logical | FALSE | Add this plot to the legend of plot shapes. |
| fontSize | double | 11 | Size of legend text. |
| fontColor | character | "black" | Color of legend text. As a valid html color (e.g. "black" or "#000000"). |
| legendTitle | character | "" | Title for the legend |
| legendTitleFontSize | double | 16 | Size of the legend title font. |
| legendTitleFontColor | character | "black" | Color of the legend title font. |
| showAxes | logical or list | FALSE | Display plot axes. Either one logical, or a list of three logicals, one for each axis (x, y, z). |
| axisLabels | list | list("X", "Y", "Z") | List of labels for the axes. |
| axisColors | character or list | "#666666" | Colors for the axes and their labels. Either one hex string (e.g. #000000), or a list of three hex strings, one for each axis (x, y, z). |
| tickBreaks | double or list | 2 | Interval of ticks on axes. Either one numerical value, or a list of three numbers, one for each axis (x, y, z). |
| showTickLines | logical, list or list of lists | FALSE | Display lines at tick intervals along axes. Either one logical, a list of three logicals, one for each axis (x, y, z), or a list of three lists with two logicals each, for each axis plane ([xy, xz], [yx, yz], [zx, zy]). |
| tickLineColors | character, list or list of lists | "#aaaaaa" | Colors for the tick lines. Either one hex string (e.g. #000000), a list of three strings, one for each axis (x, y, z), or a list of three lists with two strings, for each axis plane ([xy, xz], [yx, yz], [zx, zy]). |
| hasAnimation | logical | FALSE | Show animation of 2D to 3D point cloud. |
| animationTargets | matrix | NULL | A 2D embedding of the 3D data to be used for the unfolding animation. 2 column matrix. |
| animationDelay | integer | 100 | Number of frames before animation from 2D to 3D is started. |
| animationDuration | integer | 200 | Number of frames for transitioning between 2D and 3D. |
| animationLoop | logical | FALSE | Loop the animation (forwards and reverse). |
| turntable | logical | FALSE | Rotate the camera around the plot. |
| rotationRate | double | 0.01 | Speed of turntable rotation. A positive value rotates the camera counter clockwise, a negative value clockwise. |
| shapeLegendTitle | character | "" | Title for the plot shape legend. |
| upAxis | character | "+y" | Sets the camera up vector; Either "+x", "-x", "+y", "-y", "+z", or "-z". |
| showUI | logical | FALSE | Display buttons on the visualization. These buttons make it possible to add labels to the plot, or to export the plot as a JSON file. |
Shape clouds are 3 dimensional scatter plots, where three variables (x, y and z) define the position of 3-dimensional shapes in the coordinate system. One additional variable can be visualized by the color of the points.
Available shapes are:
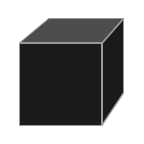

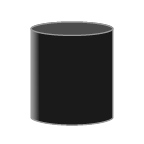
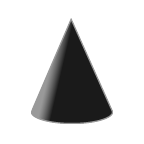
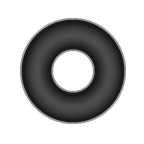
All data points of one shapeCloud plot have the same shape. You can combine multiple shape plots with different
shapes. If legendShowShape is set to TRUE, the plot will be listed in a separate legend, with its name
and shape.
Additionally, each data point can have an information string assigned to it that is displayed when the corresponding shape in the plot is clicked. These strings can include line breaks ("\n").
The shapeCloud() plotting function takes the following arguments:
| Argument | Type | Default | Description |
|---|---|---|---|
| coords | matrix | required | 3 column matrix with x, y and z coordinates. |
| colorBy | character | required | Controls how the colorVar values are interpreted. Either "categories" for discrete values, "values" for continuous values, or "direct" when colorVar is a vector of colors in hex format (e.g. "#e95420"). |
| colorVar | character or numerical vector | required | Color variable for the data points, containing category names, numerical values, or hex color strings, depending on the colorBy parameter. |
| name | character | "shape cloud" | Name of the plot for displaying it in a plot shape legend. |
| shape | character | "box" | Shape of the data points in the plot. One of c("box", "sphere", "torus", "cone", "cylinder"). |
| size | double | 1 | Point size |
| width | integer | NULL | Width of the widget, fits to the viewer pane when left empty. |
| height | integer | NULL | Height of the widget, fits to the viewer pane when left empty. |
| xScale | double | 1 | Scale x axis by a factor. |
| yScale | double | 1 | Scale y axis by a factor |
| zScale | double | 1 | Scale z axis by a factor |
| colorScale | character | NULL | Name of a colorbrewer scale (e.g. "OrRd"), "Viridis", or "custom". If set to "custom", the customColorScale parameter is also needed. |
| customColorScale | character vector | NULL | Character vector of at least 2 colors. Only needed if colorScale is set to "custom". |
| sortedCategories | character vector | NULL | Optional character vector with all category names if colorBy is "categories", to sort the categories in the legend and to the colorscale. |
| backgroundColor | character | "#ffffffff" | Color of background as hex color string. |
| showLegend | logical | TRUE | Display legend for categories of values. |
| showShape | logical | TRUE | Add this plot to the legend of plot shapes. |
| fontSize | double | 11 | Size of legend text. |
| fontColor | character | "black" | Color of legend text. As a valid html color (e.g. "black" or "#000000"). |
| legendTitle | character | "" | Title for the legend |
| legendTitleFontSize | double | 16 | Size of the legend title font. |
| legendTitleFontColor | character | "black" | Color of the legend title font. |
| showAxes | logical or list | FALSE | Display plot axes. Either one logical, or a list of three logicals, one for each axis (x, y, z). |
| axisLabels | list | list("X", "Y", "Z") | List of labels for the axes. |
| axisColors | character or list | "#666666" | Colors for the axes and their labels. Either one hex string (e.g. #000000), or a list of three hex strings, one for each axis (x, y, z). |
| tickBreaks | double or list | 2 | Interval of ticks on axes. Either one numerical value, or a list of three numbers, one for each axis (x, y, z). |
| showTickLines | logical, list or list of lists | FALSE | Display lines at tick intervals along axes. Either one logical, a list of three logicals, one for each axis (x, y, z), or a list of three lists with two logicals each, for each axis plane ([xy, xz], [yx, yz], [zx, zy]). |
| tickLineColors | character, list or list of lists | "#aaaaaa" | Colors for the tick lines. Either one hex string (e.g. #000000), a list of three strings, one for each axis (x, y, z), or a list of three lists with two strings, for each axis plane ([xy, xz], [yx, yz], [zx, zy]). |
| folded | logical | FALSE | Show animation of 2D to 3D point cloud. |
| foldedEmbedding | matrix | NULL | A 2D embedding of the 3D data to be used for the unfolding animation. 2 column matrix. |
| foldAnimDelay | integer | 100 | Number of frames before animation from 2D to 3D is started. |
| foldAnimDuration | integer | 200 | Number of frames for transitioning between 2D and 3D. |
| dpInfo | character vector | NULL | Vector with information to be displayed for each data point on click. |
| turntable | logical | FALSE | Rotate the camera around the plot. |
| rotationRate | double | 0.01 | Speed of turntable rotation. A positive value rotates the camera counter clockwise, a negative value clockwise. |
| shapeLegendTitle | character | "" | Title for the plot shape legend. |
| upAxis | character | "+y" | Sets the camera up vector; Either "+x", "-x", "+y", "-y", "+z", or "-z". |
| showUI | logical | FALSE | Display buttons on the visualization. These buttons make it possible to add labels to the plot, or to export the plot as a JSON file. |
The surface plot creates a 3 dimensional surface that is defined by a height variable for each point on a x-y plane given by the rows and columns of a 2d matrix. An additional variable can be visualized by the color of the surface points. The color is interpolated between the defined points of the surface.
The surface() plotting function takes the following arguments:
| Argument | Type | Default | Description |
|---|---|---|---|
| coords | matrix | required | 2-dimensional matrix with height data. |
| colorBy | character | required | Controls how the colorVar values are interpreted. Either "categories" for discrete values, "values" for continuous values, or "direct" when colorVar is a vector of colors in hex format (e.g. "#e95420"). |
| colorVar | character or numerical vector | required | Color variable for the data points, containing category names, numerical values, or hex color strings, depending on the colorBy parameter. |
| name | character | "shape cloud" | Name of the plot for displaying it in a plot shape legend. |
| width | integer | NULL | Width of the widget, fits to the viewer pane when left empty. |
| height | integer | NULL | Height of the widget, fits to the viewer pane when left empty. |
| xScale | double | 1 | Scale x axis by a factor. |
| yScale | double | 1 | Scale y axis by a factor |
| zScale | double | 1 | Scale z axis by a factor |
| colorScale | character | NULL | Name of a colorbrewer scale (e.g. "OrRd"), "Viridis", or "custom". If set to "custom", the customColorScale parameter is also needed. |
| customColorScale | character vector | NULL | Character vector of at least 2 colors. Only needed if colorScale is set to "custom". |
| backgroundColor | character | "#ffffffff" | Color of background as hex color string. |
| showLegend | logical | TRUE | Display legend for categories of values. |
| showShape | logical | FALSE | Add this plot to the legend of plot shapes. |
| fontSize | double | 11 | Size of legend text. |
| fontColor | character | "black" | Color of legend text. As a valid html color (e.g. "black" or "#000000"). |
| legendTitle | character | "" | Title for the legend |
| legendTitleFontSize | double | 16 | Size of the legend title font. |
| legendTitleFontColor | character | "black" | Color of the legend title font. |
| showAxes | logical or list | FALSE | Display plot axes. Either one logical, or a list of three logicals, one for each axis (x, y, z). |
| axisLabels | list | list("X", "Y", "Z") | List of labels for the axes. |
| axisColors | character or list | "#666666" | Colors for the axes and their labels. Either one hex string (e.g. #000000), or a list of three hex strings, one for each axis (x, y, z). |
| tickBreaks | double or list | 2 | Interval of ticks on axes. Either one numerical value, or a list of three numbers, one for each axis (x, y, z). |
| showTickLines | logical, list or list of lists | FALSE | Display lines at tick intervals along axes. Either one logical, a list of three logicals, one for each axis (x, y, z), or a list of three lists with two logicals each, for each axis plane ([xy, xz], [yx, yz], [zx, zy]). |
| tickLineColors | character, list or list of lists | "#aaaaaa" | Colors for the tick lines. Either one hex string (e.g. #000000), a list of three strings, one for each axis (x, y, z), or a list of three lists with two strings, for each axis plane ([xy, xz], [yx, yz], [zx, zy]). |
| turntable | logical | FALSE | Rotate the camera around the plot. |
| rotationRate | double | 0.01 | Speed of turntable rotation. A positive value rotates the camera counter clockwise, a negative value clockwise. |
| shapeLegendTitle | character | "" | Title for the plot shape legend. |
| upAxis | character | "+y" | Sets the camera up vector; Either "+x", "-x", "+y", "-y", "+z", or "-z". |
| showUI | logical | FALSE | Display buttons on the visualization. These buttons make it possible to add labels to the plot, or to export the plot as a JSON file. |
The heat map is a 3 dimensional bar chart defined similarly to the surface plot, where the height of each bar on a x-y plane is given by the value in a row-column pair of a 2d matrix. An additional variable can be visualized by the color of the bar.
The heatMap() plotting function takes the following arguments:
| Argument | Type | Default | Description |
|---|---|---|---|
| coords | matrix | required | 2-dimensional matrix with height data. |
| colorBy | character | required | Controls how the colorVar values are interpreted. Either "categories" for discrete values, "values" for continuous values, or "direct" when colorVar is a vector of colors in hex format (e.g. "#e95420"). |
| colorVar | character or numerical vector | required | Color variable for the data points, containing category names, numerical values, or hex color strings, depending on the colorBy parameter. |
| name | character | "shape cloud" | Name of the plot for displaying it in a plot shape legend. |
| size | double | 1 | Controls the width in the x and z dimensions of the pillars. Values should be between 0 and 1, values over 1 cause the pillars to intersect each other. |
| width | integer | NULL | Width of the widget, fits to the viewer pane when left empty. |
| height | integer | NULL | Height of the widget, fits to the viewer pane when left empty. |
| xScale | double | 1 | Scale x axis by a factor. |
| yScale | double | 1 | Scale y axis by a factor |
| zScale | double | 1 | Scale z axis by a factor |
| colorScale | character | NULL | Name of a colorbrewer scale (e.g. "OrRd"), "Viridis", or "custom". If set to "custom", the customColorScale parameter is also needed. |
| customColorScale | character vector | NULL | Character vector of at least 2 colors. Only needed if colorScale is set to "custom". |
| backgroundColor | character | "#ffffffff" | Color of background as hex color string. |
| showLegend | logical | TRUE | Display legend for categories of values. |
| showShape | logical | FALSE | Add this plot to the legend of plot shapes. |
| fontSize | double | 11 | Size of legend text. |
| fontColor | character | "black" | Color of legend text. As a valid html color (e.g. "black" or "#000000"). |
| legendTitle | character | "" | Title for the legend |
| legendTitleFontSize | double | 16 | Size of the legend title font. |
| legendTitleFontColor | character | "black" | Color of the legend title font. |
| showAxes | logical or list | FALSE | Display plot axes. Either one logical, or a list of three logicals, one for each axis (x, y, z). |
| axisLabels | list | list("X", "Y", "Z") | List of labels for the axes. |
| axisColors | character or list | "#666666" | Colors for the axes and their labels. Either one hex string (e.g. #000000), or a list of three hex strings, one for each axis (x, y, z). |
| tickBreaks | double or list | 2 | Interval of ticks on axes. Either one numerical value, or a list of three numbers, one for each axis (x, y, z). |
| showTickLines | logical, list or list of lists | FALSE | Display lines at tick intervals along axes. Either one logical, a list of three logicals, one for each axis (x, y, z), or a list of three lists with two logicals each, for each axis plane ([xy, xz], [yx, yz], [zx, zy]). |
| tickLineColors | character, list or list of lists | "#aaaaaa" | Colors for the tick lines. Either one hex string (e.g. #000000), a list of three strings, one for each axis (x, y, z), or a list of three lists with two strings, for each axis plane ([xy, xz], [yx, yz], [zx, zy]). |
| folded | logical | FALSE | Show animation of 2D to 3D point cloud. |
| foldedEmbedding | matrix | NULL | A 2D embedding of the 3D data to be used for the unfolding animation. 2 column matrix. |
| foldAnimDelay | integer | 100 | Number of frames before animation from 2D to 3D is started. |
| foldAnimDuration | integer | 200 | Number of frames for transitioning between 2D and 3D. |
| turntable | logical | FALSE | Rotate the camera around the plot. |
| rotationRate | double | 0.01 | Speed of turntable rotation. A positive value rotates the camera counter clockwise, a negative value clockwise. |
| shapeLegendTitle | character | "" | Title for the plot shape legend. |
| upAxis | character | "+y" | Sets the camera up vector; Either "+x", "-x", "+y", "-y", "+z", or "-z". |
| showUI | logical | FALSE | Display buttons on the visualization. These buttons make it possible to add labels to the plot, or to export the plot as a JSON file. |
Lines are 3 dimensional continuous lines that are described by the x, y and z coordinates of their vertices. Each point can also have a color variable which will be interpolated on the line connecting the points.
The linePlot() plotting function takes the following arguments:
| Argument | Type | Default | Description |
|---|---|---|---|
| coords | matrix | required | 3 column matrix with x, y and z coordinates. |
| colorBy | character | required | Controls how the colorVar values are interpreted. Either "categories" for discrete values, "values" for continuous values, or "direct" when colorVar is a vector of colors in hex format (e.g. "#e95420"). |
| colorVar | character or numerical vector | required | Color variable for the data points, containing category names, numerical values, or hex color strings, depending on the colorBy parameter. |
| name | character | "point cloud" | Name of the plot for displaying it in a plot shape legend. |
| width | integer | NULL | Width of the widget, fits to the viewer pane when left empty. |
| height | integer | NULL | Height of the widget, fits to the viewer pane when left empty. |
| xScale | double | 1 | Scale x axis by a factor. |
| yScale | double | 1 | Scale y axis by a factor |
| zScale | double | 1 | Scale z axis by a factor |
| colorScale | character | NULL | Name of a colorbrewer scale (e.g. "OrRd"), "Viridis", or "custom". If set to "custom", the customColorScale parameter is also needed. |
| customColorScale | character vector | NULL | Character vector of at least 2 colors. Only needed if colorScale is set to "custom". |
| sortedCategories | character vector | NULL | Optional character vector with all category names if colorBy is "categories", to sort the categories in the legend and to the colorscale. |
| labels | character vector | NULL | A list or vector of labels to be displayed alongside the line points. |
| labelSize | double | 100 | Size of the point labels. |
| labelColor | character | "match" | Color of the labels. Can also be "match", in which case the label takes the color of the corresponding point. |
| backgroundColor | character | "#ffffffff" | Color of background as hex color string. |
| showLegend | logical | TRUE | Display legend for categories of values. |
| showShape | logical | FALSE | Add this plot to the legend of plot shapes. |
| fontSize | double | 11 | Size of legend text. |
| fontColor | character | "black" | Color of legend text. As a valid html color (e.g. "black" or "#000000"). |
| legendTitle | character | "" | Title for the legend |
| legendTitleFontSize | double | 16 | Size of the legend title font. |
| legendTitleFontColor | character | "black" | Color of the legend title font. |
| showAxes | logical or list | FALSE | Display plot axes. Either one logical, or a list of three logicals, one for each axis (x, y, z). |
| axisLabels | list | list("X", "Y", "Z") | List of labels for the axes. |
| axisColors | character or list | "#666666" | Colors for the axes and their labels. Either one hex string (e.g. #000000), or a list of three hex strings, one for each axis (x, y, z). |
| tickBreaks | double or list | 2 | Interval of ticks on axes. Either one numerical value, or a list of three numbers, one for each axis (x, y, z). |
| showTickLines | logical, list or list of lists | FALSE | Display lines at tick intervals along axes. Either one logical, a list of three logicals, one for each axis (x, y, z), or a list of three lists with two logicals each, for each axis plane ([xy, xz], [yx, yz], [zx, zy]). |
| tickLineColors | character, list or list of lists | "#aaaaaa" | Colors for the tick lines. Either one hex string (e.g. #000000), a list of three strings, one for each axis (x, y, z), or a list of three lists with two strings, for each axis plane ([xy, xz], [yx, yz], [zx, zy]). |
| turntable | logical | FALSE | Rotate the camera around the plot. |
| rotationRate | double | 0.01 | Speed of turntable rotation. A positive value rotates the camera counter clockwise, a negative value clockwise. |
| shapeLegendTitle | character | "" | Title for the plot shape legend. |
| upAxis | character | "+y" | Sets the camera up vector; Either "+x", "-x", "+y", "-y", "+z", or "-z". |
| showUI | logical | FALSE | Display buttons on the visualization. These buttons make it possible to add labels to the plot, or to export the plot as a JSON file. |
The image stack visualizes a set of 2 dimensional slices with pixel values. The input is a tiff stack with rgb channels. It was created and optimized for fluorescent microscopy z-stack data and therefore works best with black background and bright signal.
The imgStack() plotting function takes the following arguments:
| Argument | Type | Default | Description |
|---|---|---|---|
| img | character | required | Path to RGB tiff image stack. |
| size | double | 1 | Point size |
| threshold | double or list | 0.1 | Intensity threshold for background removal. Either one number (between 0 and 1) or list of numbers with threshold for each channel. (default 0.1). |
| width | integer | NULL | Width of the widget, fits to the viewer pane when left empty. |
| height | integer | NULL | Height of the widget, fits to the viewer pane when left empty. |
| xScale | double | 1 | Scale x axis by a factor. |
| yScale | double | 1 | Scale y axis by a factor |
| zScale | double | 1 | Scale z axis by a factor |
| backgroundColor | character | "#ffffffff" | Color of background as hex color string. |
| intensityMode | character | "alpha" | Representation of pixel intensity, either "none", "alpha" or "mix". The default "alpha" generally looks best, but might be slightly slower than the other two options. |
| channelColors | list | list("#ff0000", "#00ff00", "#0000ff") | Set the colors for each of the channels, the default is for RGB images. |
| channelOpacities | list | list(1, 1, 1) | Set an overall opacity for each channel (default: list(1, 1, 1)). Only works together with intensityMode "alpha". |
| invertIntensities | logical | FALSE | Invert pixel intensity values. Set TRUE if image has dark foreground and light background. Inversion happens before thresholding. |
| showAxes | logical or list | FALSE | Display plot axes. Either one logical, or a list of three logicals, one for each axis (x, y, z). |
| axisLabels | list | list("X", "Y", "Z") | List of labels for the axes. |
| axisColors | character or list | "#666666" | Colors for the axes and their labels. Either one hex string (e.g. #000000), or a list of three hex strings, one for each axis (x, y, z). |
| tickBreaks | double or list | 2 | Interval of ticks on axes. Either one numerical value, or a list of three numbers, one for each axis (x, y, z). |
| showTickLines | logical, list or list of lists | FALSE | Display lines at tick intervals along axes. Either one logical, a list of three logicals, one for each axis (x, y, z), or a list of three lists with two logicals each, for each axis plane ([xy, xz], [yx, yz], [zx, zy]). |
| tickLineColors | character, list or list of lists | "#aaaaaa" | Colors for the tick lines. Either one hex string (e.g. #000000), a list of three strings, one for each axis (x, y, z), or a list of three lists with two strings, for each axis plane ([xy, xz], [yx, yz], [zx, zy]). |
| turntable | logical | FALSE | Rotate the camera around the plot. |
| rotationRate | double | 0.01 | Speed of turntable rotation. A positive value rotates the camera counter clockwise, a negative value clockwise. |
| upAxis | character | "+y" | Sets the camera up vector; Either "+x", "-x", "+y", "-y", "+z", or "-z". |
| showUI | logical | FALSE | Display buttons on the visualization. These buttons make it possible to add labels to the plot, or to export the plot as a JSON file. |
The meshObject visualizes a 3D model, or a scene of multiple 3D models from a glTF file.
The meshObject() plotting function takes the following arguments:
| Argument | Type | Default | Description |
|---|---|---|---|
| filepath | character | required | Path to RGB glTF file. |
| meshScaling | list | list(1, 1, 1) | List of three numbers to scale the object(s) along the axes. |
| meshRotation | list | list(0, 0, 0) | List of three numbers to rotate the object(s) along the axes. |
| meshOffset | list | list(0, 0, 0) | List of three numbers to offset the position of the object(s) along the axes. |
| width | integer | NULL | Width of the widget, fits to the viewer pane when left empty. |
| height | integer | NULL | Height of the widget, fits to the viewer pane when left empty. |
| xScale | double | 1 | Scale x axis by a factor. |
| yScale | double | 1 | Scale y axis by a factor |
| zScale | double | 1 | Scale z axis by a factor |
| backgroundColor | character | "#ffffffff" | Color of background as hex color string. |
| showAxes | logical or list | FALSE | Display plot axes. Either one logical, or a list of three logicals, one for each axis (x, y, z). |
| axisLabels | list | list("X", "Y", "Z") | List of labels for the axes. |
| axisColors | character or list | "#666666" | Colors for the axes and their labels. Either one hex string (e.g. #000000), or a list of three hex strings, one for each axis (x, y, z). |
| tickBreaks | double or list | 2 | Interval of ticks on axes. Either one numerical value, or a list of three numbers, one for each axis (x, y, z). |
| showTickLines | logical, list or list of lists | FALSE | Display lines at tick intervals along axes. Either one logical, a list of three logicals, one for each axis (x, y, z), or a list of three lists with two logicals each, for each axis plane ([xy, xz], [yx, yz], [zx, zy]). |
| tickLineColors | character, list or list of lists | "#aaaaaa" | Colors for the tick lines. Either one hex string (e.g. #000000), a list of three strings, one for each axis (x, y, z), or a list of three lists with two strings, for each axis plane ([xy, xz], [yx, yz], [zx, zy]). |
| turntable | logical | FALSE | Rotate the camera around the plot. |
| rotationRate | double | 0.01 | Speed of turntable rotation. A positive value rotates the camera counter clockwise, a negative value clockwise. |
| upAxis | character | "+y" | Sets the camera up vector; Either "+x", "-x", "+y", "-y", "+z", or "-z". |
| showUI | logical | FALSE | Display buttons on the visualization. These buttons make it possible to add labels to the plot, or to export the plot as a JSON file. |
The babyplots package uses a system of objects to create and manipulate visualizations. The objects are created using the plotting functions. Getter and setter functions are used to change the parameters of the objects.
Babyplot object
All plotting functions create a Babyplot object. When printed to the console, this object shows the visualization.
Assigning it to a variable allows you to change parameters of the visualization after its creation using getter and setter methods.
It is generally not advised to change the parameters using the $ operator, as this circumvents some checks and
side effects that are necessary for the visualization to work properly.
The babyplots object has the following slots:
| Slot | Type | Description |
| plots | list | A list of all plots that have been added to this Babyplot object. The plots themselves are either
BabyplotPlot, ImageStack,
or MeshObject objects. Which themselves also have getter and setter
methods. |
| turntable | logical | Controls the camera rotation around the plot |
| rotationRate | double | The speed at which the camera rotates around the plot, if turntable is set to TRUE |
| shapeLegendTitle | character | Title for the plot shape legend. |
| showUI | logical | Display buttons on the visualization. |
| backgroundColor | character | Color of background as hex color string. |
| xScale | double | Scale x axis by a factor. |
| yScale | double | Scale y axis by a factor |
| zScale | double | Scale z axis by a factor |
Adding a two babyplots objects together creates a new babyplots object that contains both plots in the
$plot slot. The general options (e.g. turntable, showUI, ...) are carried over from the first babyplots
object.
BabyplotPlot object
The BabyplotPlot object is created by the following plotting functions:
ImageStack object
The ImageStack object is created by the imageStack() function.
MeshObject object
The MeshObject object is created by the meshObject() function.
The Shiny package allows you to create interactive web applications in R. The babyplots package can be used in a Shiny app. The following example shows how to create a Shiny app that displays a babyplots visualization. The app allows the user to change the colorScale of the visualization.
library(shiny)
library(babyplots)

ui <- fluidPage(
    titlePanel("Babyplots Shiny App"),
    sidebarLayout(
        sidebarPanel(
            selectInput(
                "colorScale",
                "Color Scale",
                choices = c(
                    "Set1", "Set2", "Set3", "Dark2", "Paired",
                    "Pastel1", "Pastel2", "Accent"
                ),
                selected = "Set1"
            )
        ),
        mainPanel(
              babyplotOutput("bp")
        )
    )
)

server <- function(input, output, session) {
  output$bp <- renderBabyplot({
    p <- pointCloud(
        coords = matrix(rnorm(3000), ncol = 3),
        colorBy = "categories",
        colorVar = sample(letters[1:5], 1000, replace = TRUE),
        size = 4,
        colorScale = input$colorScale
    )
    getBPWidget(p)
  })
}

shinyApp(ui, server)
Notice the use of the getBPWidget() function. This function returns a htmlwidgets object that can be used in a Shiny app.
The same function is also called when printing a babyplots object in the R console, but in a Shiny app you need to call it explicitly.
Babyplots can be used in an R Markdown document when rendered to HTML. Importantly, the getBPWidget() function must be called
explicitly in the R Markdown document. The following example shows how to create an R Markdown document that displays a babyplots visualization.
---
title: "Babyplots R Markdown"
output: html_document
---

```{r}
library(babyplots)

p <- pointCloud(
    coords = matrix(rnorm(3000), ncol = 3),
    colorBy = "categories",
    colorVar = sample(letters[1:5], 1000, replace = TRUE),
    size = 4,
    colorScale = "Set1"
)
getBPWidget(p)
```
The getBPWidget() function returns a htmlwidgets object that can be used in an R Markdown document.
The same function is also called when printing a babyplots object in the R console, but in an R Markdown document you need to call it explicitly.