Babyplots is an easy to use library for creating interactive 3d graphs for exploring and presenting data. This documentation page describes the babyplots PowerPoint add-in available from the Office add-in store.
You can install the babyplots add-in from the Office add-in store found in the "insert" section of the menu ribbon in Microsoft PowerPoint. Then it can be added to a presentation using the "My add-ins" button in the "insert" section.
When inserting the add-in on a slide of your presentation, you will be greeted with the following start screen (Fig. 1).
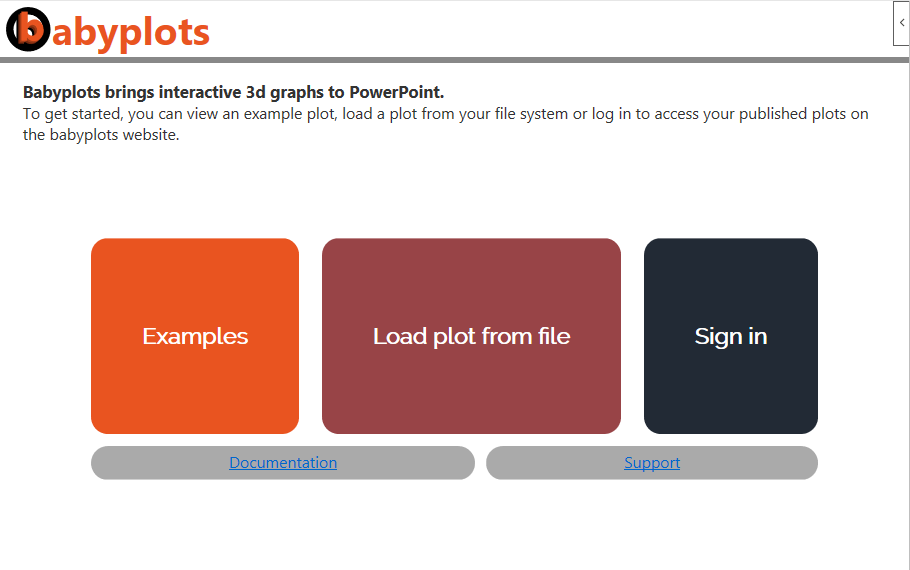 Fig. 1: Start screen of the babyplots PowerPoint add-in.
You can navigate through the different functions of the add-in by clicking the three large buttons, Examples, Load plot from file, and Sign In. These buttons will be described in further detail in the following sections.
Below the three main buttons, you can find a link to this documentation page, as well as a link to the support page.
To get started with the add-in, it might be interesting to see what is possible when embedding babyplots functionality in a PowerPoint presentation. That is why we have included four examples that show the four different plot types currently available in babyplots. Clicking on the Examples button in the start screen brings you to the example selection screen, shown in Fig. 2 below.
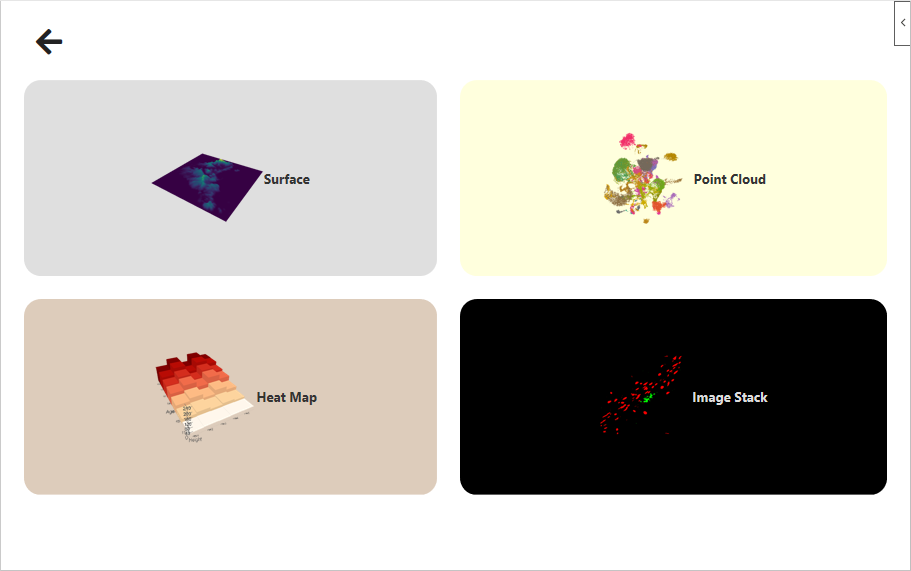 Fig. 2: Example screen showing the four different plot types.
On the example screen, you can see big buttons with previews of the different plot types. Clicking on one of those will display the chosen plot (Fig. 3). In the top left, a button with an arrow pointing to the left will take you back to the start screen.
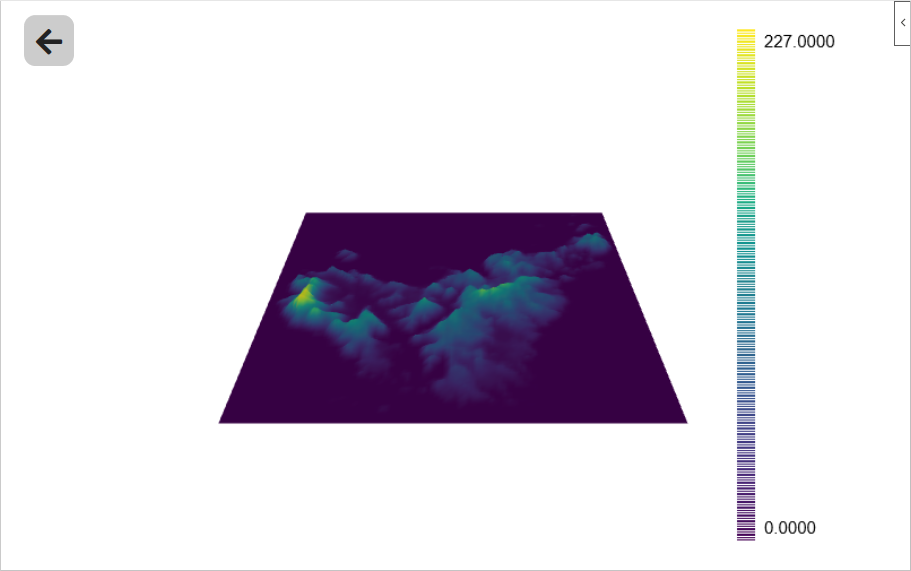 Fig. 3: Full view of one of the example plots.
You can return from the plot view using the button with an arrow pointing to the left in the top left corner. This will bring you back to the main screen from where you can choose a different example plot or load your own plots as described in the following sections.
After you have created a plot in R, Python , JavaScript, or in the Creator, you can export your plot as a .json file. Clicking on the Load plot from file button on the start screen (Fig. 1), brings you to a file selection field, where you can choose your exported plot file. After the plot is loaded, it will displayed in the add-in.
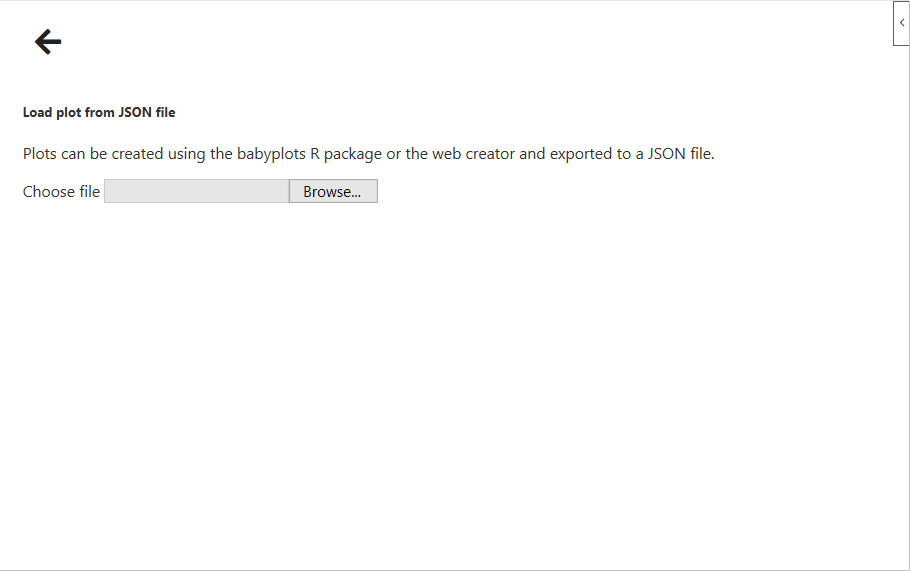 Fig. 4: The load plot from json section.
Saving the PowerPoint presentation after embedding a babyplot, also saves the currently active plot.
You are not required to register on the babyplots website to use the plotting functionality and this PowerPoint add-in. However, signing up, allows you to publish plots to easily share them with friends or colleagues and to embed your plots in your PowerPoint presentation without exporting them to .json.
Make sure to create an account and validate it before using this functionality in the PowerPoint add-in.
Clicking on the sign in button in the start screen (Fig. 1) brings you to a form where you will be asked to provide your username and password on the babyplots website. After a successful login, you will see a list of your published plots (Fig. 5). Clicking on one of the list items will display the corresponding plot.
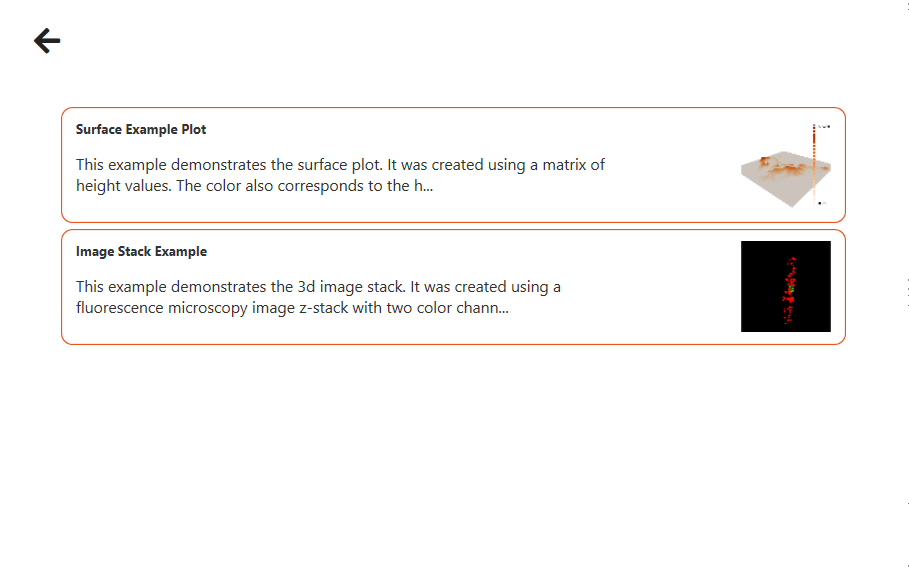 Fig. 5: List of your published plots on the babyplots website.
Saving the PowerPoint presentation after embedding a babyplot, also saves the currently active plot.