Babyplots is an easy to use library for creating interactive 3d graphs for exploring and presenting data.
The python package allows you to create and include babyplots visualizations in Jupyter notebooks.
You can install the babyplots package using pip:
pip install babyplotsYou can use the babyplots python package in Jupyter notebooks. To get started, import the Babyplot class:
from babyplots import BabyplotOnce imported, you can create a babyplots visualization using the Babyplot class by adding plots to it. To display your visualization, simply call the object.
bp = Babyplot()

bp.add_plot(coordinates, "pointCloud", "categories", clusters, {"colorScale": "Paired"})

bp
Below is a minimal example using the Iris data set, adapted from the scikit-learn documentation:
import numpy as np
from sklearn import decomposition
from sklearn import datasets
from babyplots import Babyplot
np.random.seed(5)

# load the data set
iris = datasets.load_iris()
X = iris.data
y = iris.target

# create the babyplots visualization
bp = Babyplot()
bp.add_plot(X.tolist(), "shapeCloud", "categories", y.tolist(), {"shape": "sphere",
                                                                 "colorScale": "Set2",
                                                                 "showAxes": [True, True, True],
                                                                 "axisLabels": ["PC 1", "PC 2", "PC 3"]})
# show the visualization
bp
You can see this example (and a few more) in action in a demo notebook here. Below, you will find the complete documentation on the Babyplot class and its methods, as well as the available plot types and their options.
The Babyplot stores the data and options for the visualizations and its methods allow you to add plots
to it, display, and save it. The instantiation method can take the following arguments that let you customize the
visualization:
| Argument | Type | Default | Description |
|---|---|---|---|
| width | integer | 640 | Width of the visualization |
| height | integer | 480 | Height of the visualization |
| background_color | string | "#ffffffff" | Background color of the visualization in hex format (rgba). |
| turntable | bool | False | Setting turntable to True spins the camera around the plots at a constant speed. |
| rotation_rate | float | 0.01 | The speed at which the camera turns around the plots if turntable is set to True. A positive value rotates the camera counter clockwise, a negative value clockwise. |
| x_scale | float | 1 | Apply a scaling factor to the x axis. |
| y_scale | float | 1 | Apply a scaling factor to the y axis. |
| z_scale | float | 1 | Apply a scaling factor to the z axis. |
| shape_legend_title | string | "" | Title of the legend showing the names and plot types of multiple plots, if at least one plot has legendShowShape enabled. |
| show_ui | bool | False | Display control buttons on the visualization that allow annotating the plot with labels, exporting the plot as a .json file and publishing the plot to https://bp.bleb.li. |
| up_axis | string | "+y" | Sets the camera up vector; Either "+x", "-x", "+y", "-y", "+z", or "-z". |
The Babyplot class contains methods to add visualizations and save the visualization for use outside of the jupyter notebook.
add_plot(coordinates, plot_type, color_by, color_var, options)
The add_plot() method adds a plot to the Babyplot object. Refer to the plot types
section for the different kinds of visualizations that can be created using this method. The
add_plot() method takes the following arguments.
| Argument | Type | Description |
|---|---|---|
| coordinates | list[list[float]] or numpy ndarray | A list of lists with coordinates of data points. Refer to the plot types section for the required format for each plot type. |
| plot_type | string | The name of one of the plot types. Either "pointCloud", "shapeCloud", "heatMap", or "surface". |
| color_by | string | How to interpret the color_var parameter, either "direct", "categories", or "values". If color_var is an list of hex strings, color_by should be "direct". If color_var is an list of discrete values (e.g. category names), color_by should be "categories". If color_var is an list of continuous values, color_by should be "values". |
| color_var | list[float] or list[string] or numpy ndarray | The variable to use for coloring the data points; Either a list of discrete categories, numerical values, or colors in hex format (e.g. "#ff0000"). |
| options | Dict | A dictionary of general and plot type specific options. See the table below for possible options. |
The following options apply to all plot types. You can find plot type specific options in the plot types section.
| Option | Type | Description |
|---|---|---|
| name | string | Name of the plot. Displayed in the shape legend if legendShowShape is set to true. |
| colorScale | string | Sets the color scale for the plot. The name of any colorbrewer color scale or "Viridis". |
| customColorScale | list[string] | If colorScale is set to "custom", a custom color scale can be created using an list of colors in hex format. The colors are interpolated if colorBy is set to "values" or if there are not enough colors for all categories in customColorScale. |
| colorScaleInverted | bool | Inverts the color scale if set to true. |
| sortedCategories | list[string] | By default, categories are sorted alphabetically. If this is not wanted, you can supply an list of category names in the order in which you would like them to be sorted in the legend and the color scale. |
| showLegend | bool | Display the color scale legend? |
| legendShowShape | bool | If set to true, the plot is shown in a separate shape legend with its symbol and name. |
| fontSize | integer | Font size for the legend. |
| fontColor | string | Color for the legend text in hex format. |
| legendTitle | string | Title for the legend. |
| legendTitleFontSize | integer | Font size for the legend title. |
| legendTitleFontColor | string | Color for the legend title. |
| legendPosition | string | Controls the position of the legend. Either "left", or "right". If not specified, the legend of the first plot will be positioned on the right, the second on the left. More than 2 legends are not supported. |
| showAxes | list[bool] | Display plot axes? showAxes takes an list of length three, one boolean for each of the three axes (x, y, and z). |
| axisLabels | list[string] | List of length three for the labels of the three axes. E.g. ["X", "Y", "Z"]. |
| axisColors | list[string] | List of length three for the colors of the three axes in hex format. |
| tickBreaks | list[float] | List of length three for the interval between ticks of the three axes. |
| showTickLines | list[list[bool]] | Display lines across the axes? List of length three with lists of length two for all combinations ([[xy, xz], [yx, yz], [zx, zy]]). |
| tickLineColors | list[list[string] | Colors for the tick lines in hex format. Same order as in showTickLines. |
add_plot() can be called multiple times on the same Babyplot object to combine visualizations.
add_plot_from_dataframe(dataframe, plot_type, color_by, color_var, coord_columns, options)
The add_plot_from_dataframe() method adds a plot to the Babyplot object. Refer to the plot types
section for the different kinds of visualizations that can be created using this method. The
add_plot_from_dataframe() method takes the following arguments.
The dataframe can either contain the coordinates and a column for the color variable, or just the coordinates. If the dataframe contains the color variable, the color_var parameter must be a string with the name of the color variable column. Otherwise, the color_var parameters must be the list of color variables (as in the add_plot method).
| Argument | Type | Description |
|---|---|---|
| dataframe | pandas dataframe | The pandas dataframe from which to take the coordinates for the plot and optionally a column for the color variable. |
| plot_type | string | The name of one of the plot types. Either "pointCloud", "shapeCloud", "heatMap", or "surface". |
| color_by | string | How to interpret the color_var parameter, either "direct", "categories", or "values". If color_var is an list of hex strings, color_by should be "direct". If color_var is an list of discrete values (e.g. category names), color_by should be "categories". If color_var is an list of continuous values, color_by should be "values". |
| color_var | string or list[float] or list[string] | Either the name of the column of the dataframe that contains the variable to use for coloring, or the variable to use for coloring the data points itself; In the second case, either a list of discrete categories, numerical values, or colors in hex format (e.g. "#ff0000"). |
| coord_columns | List[string] | If the dataframe contains more columns than those for the coordinates and the color variable, the coord_columns parameter must be a list with the column names that contain the coordinates for the plot. |
| options | Dict | A dictionary of general and plot type specific options. See the table below for possible options. |
The following options apply to all plot types. You can find plot type specific options in the plot types section.
| Option | Type | Description |
|---|---|---|
| name | string | Name of the plot. Displayed in the shape legend if legendShowShape is set to true. |
| colorScale | string | Sets the color scale for the plot. The name of any colorbrewer color scale or "Viridis". |
| customColorScale | list[string] | If colorScale is set to "custom", a custom color scale can be created using an list of colors in hex format. The colors are interpolated if colorBy is set to "values" or if there are not enough colors for all categories in customColorScale. |
| colorScaleInverted | bool | Inverts the color scale if set to true. |
| sortedCategories | list[string] | By default, categories are sorted alphabetically. If this is not wanted, you can supply an list of category names in the order in which you would like them to be sorted in the legend and the color scale. |
| showLegend | bool | Display the color scale legend? |
| legendShowShape | bool | If set to true, the plot is shown in a separate shape legend with its symbol and name. |
| fontSize | integer | Font size for the legend. |
| fontColor | string | Color for the legend text in hex format. |
| legendTitle | string | Title for the legend. |
| legendTitleFontSize | integer | Font size for the legend title. |
| legendTitleFontColor | string | Color for the legend title. |
| legendPosition | string | Controls the position of the legend. Either "left", or "right". If not specified, the legend of the first plot will be positioned on the right, the second on the left. More than 2 legends are not supported. |
| showAxes | list[bool] | Display plot axes? showAxes takes an list of length three, one boolean for each of the three axes (x, y, and z). |
| axisLabels | list[string] | List of length three for the labels of the three axes. E.g. ["X", "Y", "Z"]. |
| axisColors | list[string] | List of length three for the colors of the three axes in hex format. |
| tickBreaks | list[float] | List of length three for the interval between ticks of the three axes. |
| showTickLines | list[list[bool]] | Display lines across the axes? List of length three with lists of length two for all combinations ([[xy, xz], [yx, yz], [zx, zy]]). |
| tickLineColors | list[list[string] | Colors for the tick lines in hex format. Same order as in showTickLines. |
add_plot_from_dataframe() can be called multiple times on the same Babyplot object to combine
visualizations.
add_tiff(image_path, threshold, channel_thresholds, options)
The add_tiff() method adds a 3d image stack from a tiff file to the Babyplot object. This visualization
was created and optimized for fluorescent microscopy z-stack data and therefore works best with black background and
bright signal.
The add_tiff() method takes the following arguments:
| Argument | Type | Description |
|---|---|---|
| image_path | string | File path of the tiff image stack. |
| threshold | float | A global threshold for all color channels. Default: 0.1 |
| channel_thresholds | list[float] | A list of individual thresholds, one for each channel. Default: None |
| options | Dict | A dictionary of options. See the table below for possible options. |
The following options can be set:
| Option | Type | Description |
|---|---|---|
| size | float | The size of the 3d pixels |
| intensityMode | string | Controls how the pixel intensity is visualized. The default "alpha" gives an opacity to the 3d pixels based on the intensity value. "mix" mixes the pixel color with the background color of the canvas. "none" displays all 3d pixels at full brightness, regardless of the intensity value. |
| channelColors | list[str] | Set the colors for each of the channels. |
| channelOpacities | list[str] | Set the opacities for each of the channels. Only works with intensityMode "alpha" |
| showAxes | list[bool] | Display plot axes? showAxes takes an list of length three, one boolean for each of the three axes (x, y, and z). |
| axisLabels | list[string] | List of length three for the labels of the three axes. E.g. ["X", "Y", "Z"]. |
| axisColors | list[string] | List of length three for the colors of the three axes in hex format. |
| tickBreaks | list[float] | List of length three for the interval between ticks of the three axes. |
| showTickLines | list[list[bool]] | Display lines across the axes? List of length three with lists of length two for all combinations ([[xy, xz], [yx, yz], [zx, zy]]). |
| tickLineColors | list[list[string]] | Colors for the tick lines in hex format. Same order as in showTickLines. |
add_img_stack(values, indices, attributes, options)
The add_img_stack() method underlies the add_tiff() function. This method expects the 3d
image stack to be in a special format optimized for small size in json format. It is recommended to use the
add_tiff() method to add an image directly from a file. The add_img_stack() method can
take the following arguments:
| Argument | Type | Description |
|---|---|---|
| values | list[float] | A list of pixel intensities at the image pixels given by the indices parameter. |
| indices | list[int] | A list of indices of included pixels. Used to reconstruct the 3d image. The order of the pixels is: [Z, C, Y, X] |
| attributes | Dict | A dictionary with image attributes. Must at least have the "dim" key, giving the dimensions of the 3d image stack. |
| options | Dict | A dictionary options. See the table in the add_tiff section. |
add_mesh_object(image_path, threshold, channel_thresholds, options)
The add_mesh_object() method adds a 3D model or scene of 3D models from a glTF file to the Babyplots
object.
The add_mesh_object() method takes the following arguments:
| Argument | Type | Description |
|---|---|---|
| filepath | string | File path of the glTF file. |
| options | Dict | A dictionary of options. See the table below for possible options. |
The following options can be set:
| Option | Type | Description |
|---|---|---|
| meshScaling | list[float] | List of three numbers to scale the object(s) along the axes. |
| meshRotation | list[float] | List of three numbers to rotate the object(s) along the axes. |
| meshOffset | list[float] | List of three numbers to offset the position of the object(s) along the axes. |
| showAxes | list[bool] | Display plot axes? showAxes takes an list of length three, one boolean for each of the three axes (x, y, and z). |
| axisLabels | list[string] | List of length three for the labels of the three axes. E.g. ["X", "Y", "Z"]. |
| axisColors | list[string] | List of length three for the colors of the three axes in hex format. |
| tickBreaks | list[float] | List of length three for the interval between ticks of the three axes. |
| showTickLines | list[list[bool]] | Display lines across the axes? List of length three with lists of length two for all combinations ([[xy, xz], [yx, yz], [zx, zy]]). |
| tickLineColors | list[list[string]] | Colors for the tick lines in hex format. Same order as in showTickLines. |
save_as_html(path, fullscreen, title)
The save_as_html() method saves the babyplots visualization as an html file at the given path. It takes
the following arguments:
| Argument | Type | Description |
|---|---|---|
| path | string | Filepath for the output file. |
| fullscreen | bool | If set to True, the visualization will fill the viewport, if not, it will conform to the dimensions set in the Babyplot object. Default: False |
| title | string | The title of the html document. Default: "Babyplot" |
as_html(standalone, fullscreen, title)
The as_html() method underlies the save_as_html() method. Depending on the
standalone argument, it returns a string containing either (if True) a complete html document with the
babyplots visualization, or (if False) only the html+js snippet containing the babyplots canvas and the plot data.
The latter case is useful for including the plot in another document (in this case, babyplots JavaScript library has
to be included separately, see the JavaScript
documentation).
The as_html() method takes the following arguments:
| Argument | Type | Description |
|---|---|---|
| standalone | bool | If True, the returned string is a complete html document, if False, only the canvas and the plot data. Default: True |
| fullscreen | bool | If set to True, the visualization will fill the viewport, if not, it will conform to the dimensions set in the Babyplot object. Default: False |
| title | string | The title of the html document. Default: "Babyplot" |
save_as_json(path)
The save_as_json() method saves the babyplots visualization as a json file at the given path. It takes
the following argument:
| Argument | Type | Description |
|---|---|---|
| path | string | Filepath for the output file. |
as_json()
The as_json() returns the babyplots visualization as a json formatted string.
The following four plot types are available from the add_plot() method through the plot_type parameter.
"pointCloud"Creates a cloud of data points defined by their x, y and z coordinates (in an list of lists, [[x1, y1, z1], [x2, x2, x2], ..., [xn, yn, zn]]), as well as another variable that controls the color of each data point (in an list in the same order as the coordinates, [c1, c2, ..., cn]). This can be a color value in hex format, a numerical value, or a category name.
Each data point in the point cloud can also have a second set of coordinates and an animation can be played transitioning between the two sets of coordinates.
The following plot type specific options are available in addition to the general options outlined in the
add_plot() section.
| Option | Type | Description |
|---|---|---|
| size | float | Controls the size of the points. |
| hasAnimation | bool | Include an animation between two sets of coordinates for each point. |
| animationTargets | list[list[float]] | The second set of coordinates for each point in the same format and order as in the coordinates parameter. |
| animationDelay | integer | Time in frames after which the animation should be played. |
| animationDuration | integer | The duration of the animation in frames. |
| animationLoop | bool | Loop the animation (forwards and reverse). |
| addClusterLabels | bool | In plots colored by categories, add 3D labels at the centroids of the points belonging to each category. Placement and label text can be customized using the label manager. |
"shapeCloud"Creates a cloud of data points represented as predefined 3-dimensional shapes defined by their x, y and z coordinates (in an list of lists, [[x1, y1, z1], [x2, x2, x2], ..., [xn, yn, zn]]), as well as another variable that controls the color of each data point (in an list in the same order as the coordinates, [c1, c2, ..., cn]). This can be a color value in hex format, a numerical value, or a category name.
Available shapes are:
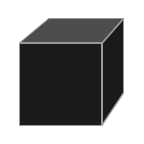

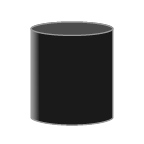
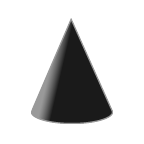
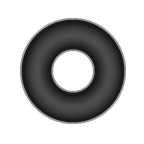
All data points of one shapeCloud plot have the same shape. You can combine multiple shape plots with different
shapes. If legendShowShape is set to true, the plot will be listed in a separate legend, with its name
and shape.
Additionally, each data point can have an information string assigned to it that is displayed when the corresponding shape in the plot is clicked. These strings can include line breaks ("\n").
The following plot type specific options are available in addition to the general options outlined in the
add_plot() section.
| Option | Type | Description |
|---|---|---|
| shape | string | Defines the shape of the data points. Available shapes are: "box", "sphere", "cylinder", "cone", and "torus". |
| size | float | Controls the size of the shapes. |
| dpInfo | list[string] | List of strings of same length as there are data points in the plot. |
"surface"Creates a surface from height data. The coordinates argument takes the height y in a matrix (column x row): [[y1,1, y2,1, ..., yn,1], [y1,2, y2,2, ..., yn,2], ..., [y1,n, y2,n, ..., yn,n]]. Each data point in the surface also has a color variable: [c1,1, c2,1, ..., cn,1, c1,2, ..., cn,n]. This can be a color value in hex format, or a numerical value. The color of the area between the points is interpolated.
The surface plot has no additional options besides the general options outlined in the add_plot()
section.
"heatMap"Creates a 3-dimensional bar plot where each data point of a matrix (column x row) is represented by a pillar of height y: [[y1,1, y2,1, ..., yn,1], [y1,2, y2,2, ..., yn,2], ..., [y1,n, y2,n, ..., yn,n]]. Each data point also has a color variable: [c1,1, c2,1, ..., cn,1, c1,2, ..., cn,n]. This can be a color value in hex format, a numerical value, or a category name.
The following plot type specific options are available in addition to the general options outlined in the
add_plot() section.
| Option | Type | Description |
|---|---|---|
| size | float | Controls the width in the x and z dimensions of the pillars. Values should be between 0 and 1, values over 1 cause the pillars to intersect each other. |
| colnames | list[string] | Names of columns to be displayed on the x and z axes. |
| rownames | list[string] | Names of rows to be displayed on the x and z axes. |
"line"Creates a continuous line described by points defined by their x, y and z coordinates (in an array of arrays, [[x1, y1, z1], [x2, x2, x2], ..., [xn, yn, zn]]), as well as another variable that controls the color of each point (in an array in the same order as the coordinates, [c1, c2, ..., cn]). This can be a color value in hex format, a numerical value, or a category name. The colors of two subsequent points are interpolated along the line between the two points.
Each point along the line can also have a text label that is drawn next to the points and can be controlled in their size and color.
The following plot type specific options are available in addition to the general options outlined in the
add_plot() section.
| Option | Type | Description |
|---|---|---|
| labels | list[string] | Labels for the points along the line. An array of the same length as numbers of points on the line. |
| labelSize | float | Size of the labels (default: 100) |
| labelColor | string | The color of the labels. Either a color hex string, or "match". If set to "match", the labels are colored according to the corresponding point color (defined in color_var). |